Container Forming Simulation: The world is 3D
The real world is 3-D and nearly all containers produced have an unsymmetrical thickness distribution, even though the mold shape is axis-symmetric. In order to reduce the container weight or to achieve the increasing product quality by simultaneously reducing the costs it is fundamental to understand all mechanisms in glass forming processes.
Nogrid provides CFD (Computational Fluid Dynamics) software developed especially for the container glass industry. Nogrid software can compute glass forming processes in full 3D and allows simulating all kinds of glass forming processes, amongst others for container glass:
- BB (Blow and Blow)
- PB (Press and Blow or Wide Mouth PB)
- NNPB (Narrow Neck Press and Blow)
In this paper the focus of attention lay on the glass forming, that means on the flow of the glass and for that reason the blank mold and the blow mold are replaced by approximate models.
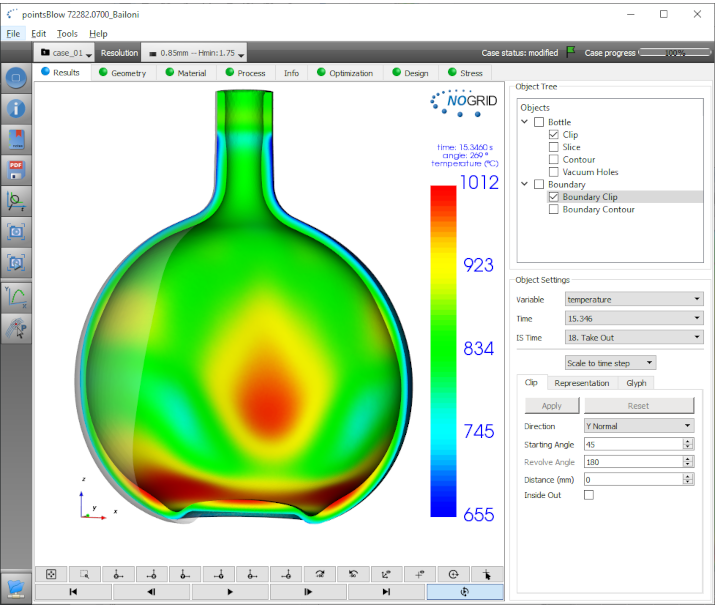
Figure 1: Result view of non axis-symmetric container
Figure 2 shows schematically the process steps that occur during the BB process, which was used in this investigation.
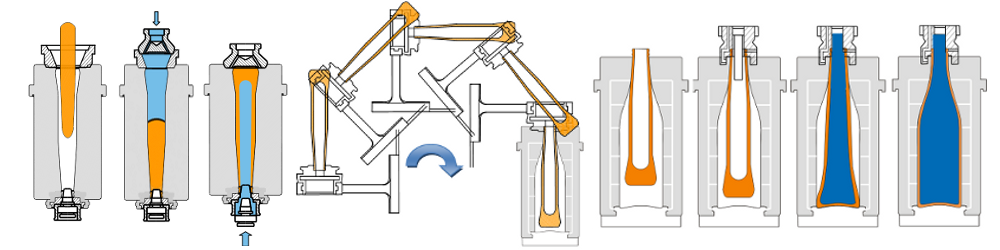
Figure 2: Schematic steps during BB process
The real world is 3-D and nearly all produced containers have an unsymmetrical thickness distribution, even though the mold shape is axis-symmetric. Simulation helps to understand and classify all mechanisms or effects which are responsible for unsymmetrical thickness distribution. Some mechanisms are hidden and coupled with each other and therefore it is very difficult to distinguish between them by experiments.
For instance, if you notice a certain unexpected container wall thickness distribution (e.g. too much glass in the neck area), it is sometimes not clear, what the reasons are:
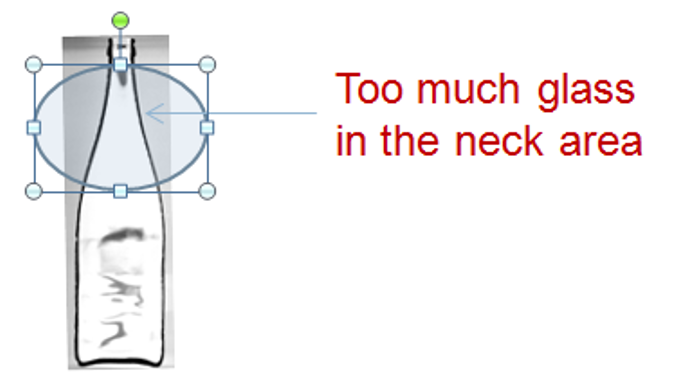
Cross section of container produced
- neck mold area too cold
- glass contact time too long
- gob temperature too low
- gob shape not correct
- or other causes.
In production one cannot simply increase the gob temperature, because also the gob shape will change in that case. That means one cannot distinguish what is the effect of temperature and what is the effect of gob shape. In simulation we can change the gob temperature and the gob shape remains the same. Thus, with computer simulation one can investigate each cause of defect independently from others and as a result one is able to investigate the dependencies step by step.
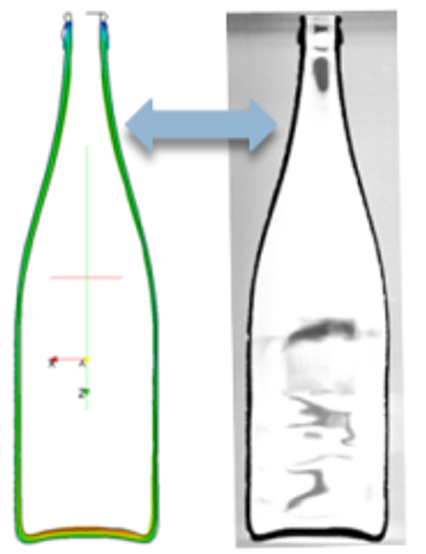
Comparison simulation - real
The most sensible material property for the glass forming process is the viscosity, which depends on temperature. Unfortunately glass temperatures are often entirely unknown and can be measured only with considerable effort. For that reason one important question very often is: What is the influence of the gob temperature on the container wall thickness distribution and what happens if the temperature distribution within the gob is not homogeneous? Beside inhomogeneous temperatures a non-symmetric gob load is also a major reason for an irregular wall thickness distribution. In this paper we will give some answers to these questions. As in reality, the simulation starts with gob loading and ends at take out. All process steps are integrated into one computer model and all walls are switched on and off at the corresponding time step given by the IS machine time data: The walls for the plunger, blank mold, blank mold bottom and final mold are combined to one single geometrical model. The software switches the corresponding faces on and off according to the IS time data.
Theory and Data
We solve the complete Navier-Stokes equations (continuity equation, velocity equations and energy equation) within the fluid. The glass viscosity depends on temperature as shown in Figure 3.
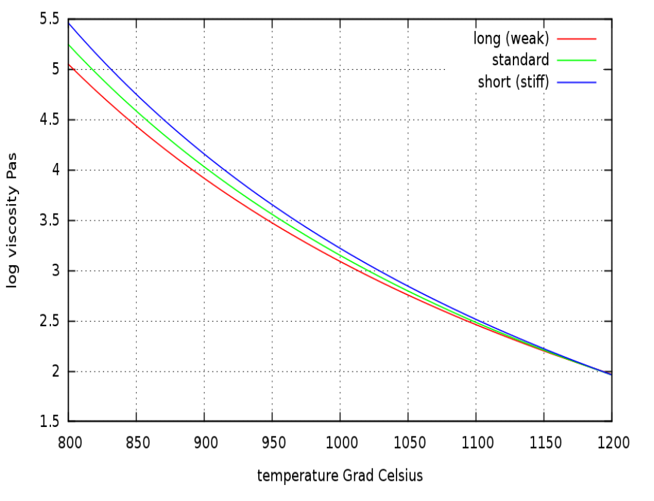
Figure 3: Viscosity depends on temperature
In the container glass industry the glass composition and therefore the glass properties can vary, but usually soda lime silica glass is used. We used the standard container glass for the computations in this paper. The blank mold, the blow mold and the plug are replaced by an approximate heat flux boundary condition
Q = h A ( Tglass-Tmold )
h is the heat transfer coefficient, T is the glass temperature at the interface glass-mold and Tmold is the temperature of the mold. The heat transfer coefficient h used is constant over time, but if better experimental data is available this can be modified easily. Two containers are considered for this investigation (see Figure 4 ); one has an axis-symmetric shape (C1) and the other not (C2).

Figure 4: Shape of containers used for investigation
We investigated the following conditions for both containers and all simulations are obtained by full 3-D computations:
- Symmetrical loading with homogeneous gob temperature
- Loading with homogeneous gob temperature, but the initial gob position is displaced from the center axis
- Gob loading position is centered, but the initial gob temperature is non-homogeneous.
Results
The conditions for the container C1 are:
Case C1-0
Symmetrical loading with homogeneous gob temperature
Case C1-1
Loading with homogeneous gob temperature, but the initial gob position is 2 mm displaced from the center axis.
Case C1-2
Gob loading position is centered, but the initial gob temperature is non-homogeneous. The gob temperature is 1163 °C in the center and decreases to 1126 °C on left side and increases to 1199 °C on the right side (see Figure 9). Thus, the maximum temperature difference in the gob is ∆T= 72 °C.
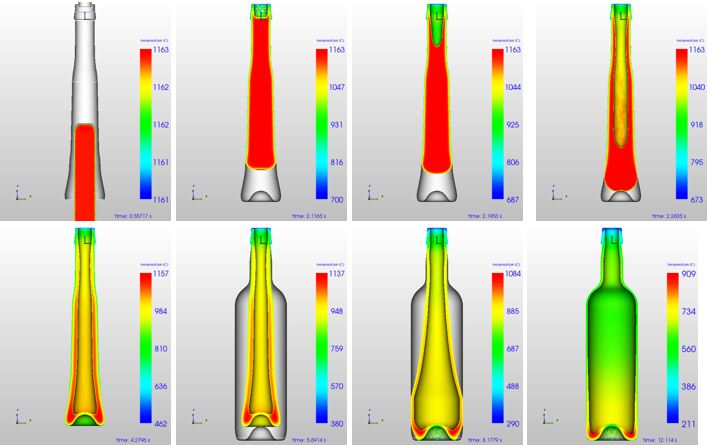
Figure 5: Time steps for C1-0: symmetrically loading
Some single time steps for Case C1-0 are shown in Figure 5. The color is the temperature in °C. The final thickness distribution is shown in Figure 6. As temperature is homogeneous for the initial gob and loading is symmetrically, all results are symmetrically as well.
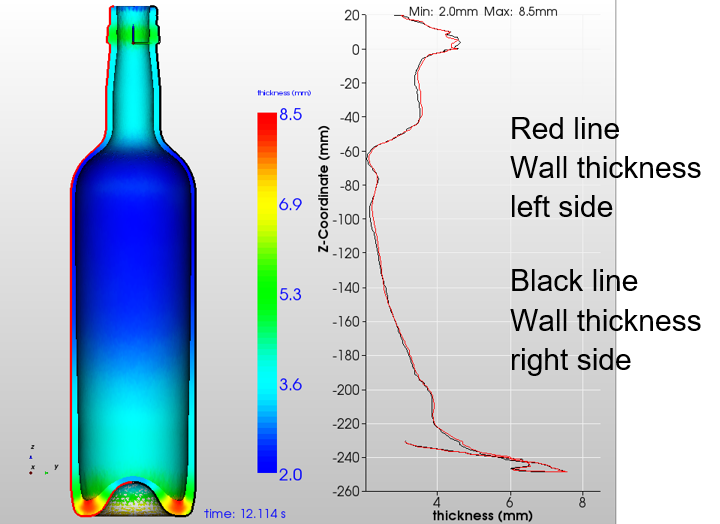
Figure 6: Wall thickness for C1-0: symmetrically loading
If the initial gob position is 2 mm displaced from the center axis, the gob will touch the blank mold wall not symmetrically and a time shift for the contact time occur from left to right side of the gob (see Figure 7). Glass parts which are longer in contact with cold molds are cooling down faster and as a result the wall thickness increases. The final wall thickness distribution is plotted in Figure 8 and there is only a small difference between the left and right wall thickness of 0.25 mm.
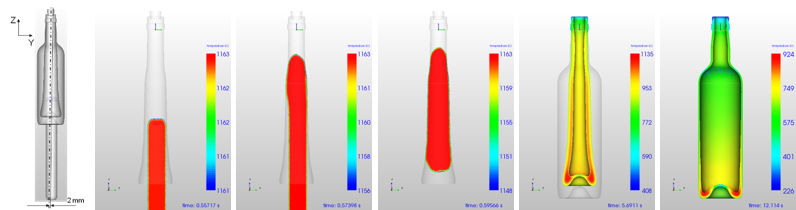
Figure 7: C1-1 Time steps: Loading 2 mm displaced
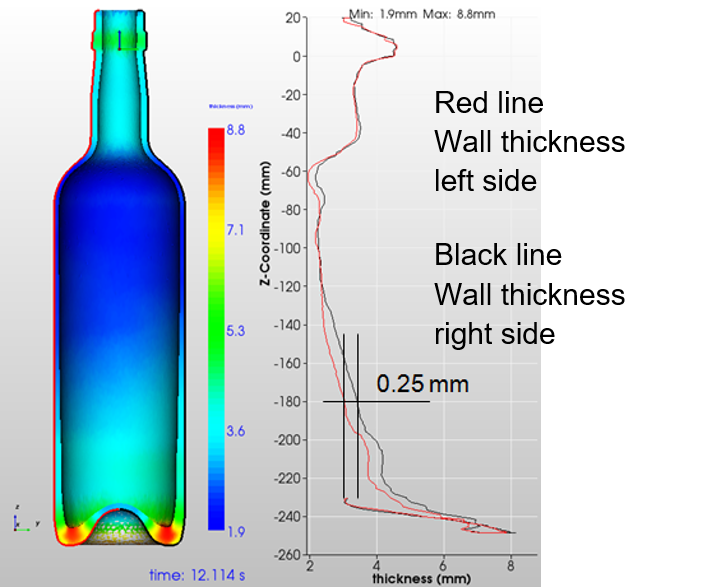
Figure 8: C1-1 Thickness: Loading 2 mm displaced
Next step is to compute the C1-2 case, where temperature difference in the initial gob is ∆T= 72 °C initially. Some images of the temperature at different time steps are shown in Figure 9. As one can see during final blowing the glass is blown to the right side of the blow mold and the flow is completely non-symmetric. Interesting to mention is, that the gob was initially colder on the left side and one would expect that in the final container the left side is thicker as well.
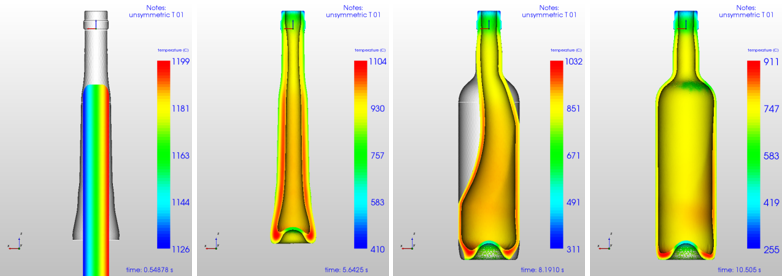
Figure 9: C1-2 Time steps: gob-∆T= 73°C difference
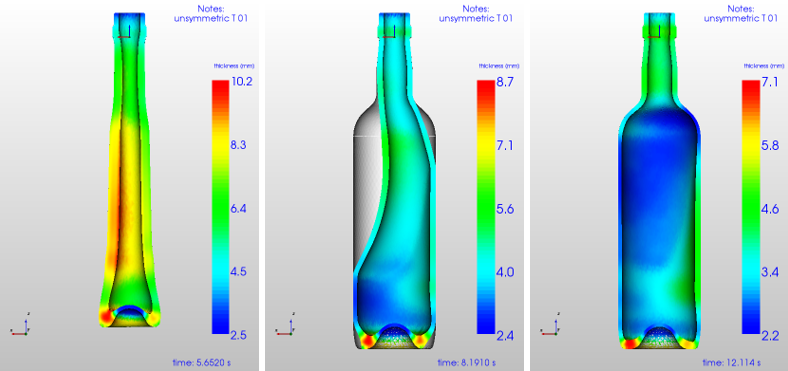
Figure 10: C1-2 Thickness: gob-∆T= 73°C
But referring to Figure 10 one can see that the container is much thicker on the right side. This is understandable considering the thickness distribution in the parison. As one can see in Figure 10 (left image) the left side is much thicker than the right side. This is what we expected, but during final blow the flow is always directed in that direction where the lowest resistance occurs. For that reason the complete glass parison moves in the direction with the smallest wall thickness and highest temperature and as a result the wall thickness is higher on the right side.
Due to the inhomogeneous gob temperature the maximum wall thickness at the left side is 2.2 mm whereas on the right side 4.6 mm is computed. Thus, a temperature gradient of 73°C within the gob generates a wall thickness difference of 2.4 mm. If it is allowed to make a linear approximation, one can say, that 1 °C temperature gradient (perpendicular to the gob axis) will produce 0.3 mm thickness differences in the final wall thickness of this container.
The conditions for the container C2 are:
Case C2-0
Symmetrical loading with homogeneous gob temperature.
Case C2-1
Loading with homogeneous gob temperature, but the initial gob position is 5 mm displaced from the center axis.
Case C2-2
Gob loading position is centered, but the initial gob temperature is non-homogeneous. The gob temperature starts with 1134 °C on the left side und increases to 1184 °C on the right side. The maximum temperature difference in the gob is ∆T=50 °C.
Case C2-3
Gob loading position is centered, but the initial gob temperature is non-homogeneous. The gob temperature starts with 1109 °C on the left side und increases to 1209 °C on the right side. The maximum temperature difference in the gob is ∆T=100 °C.
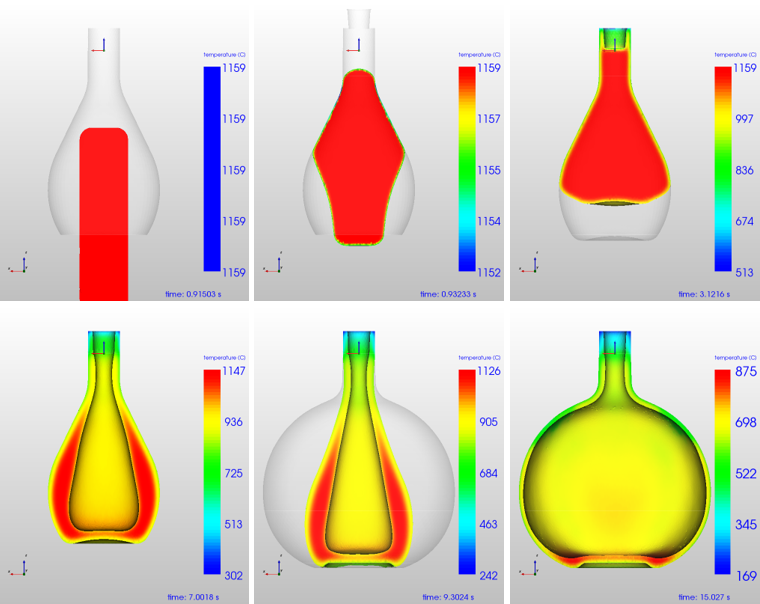
Figure 11: Time steps for C2-0: symmetrical loading
In Figure 11 the single time steps for Case C2-0 are shown and the color is the temperature in °C. The final thickness distribution is shown in Figure 12. As temperature is homogeneous for the initial gob and loading is symmetrical, all results are symmetrical as well.
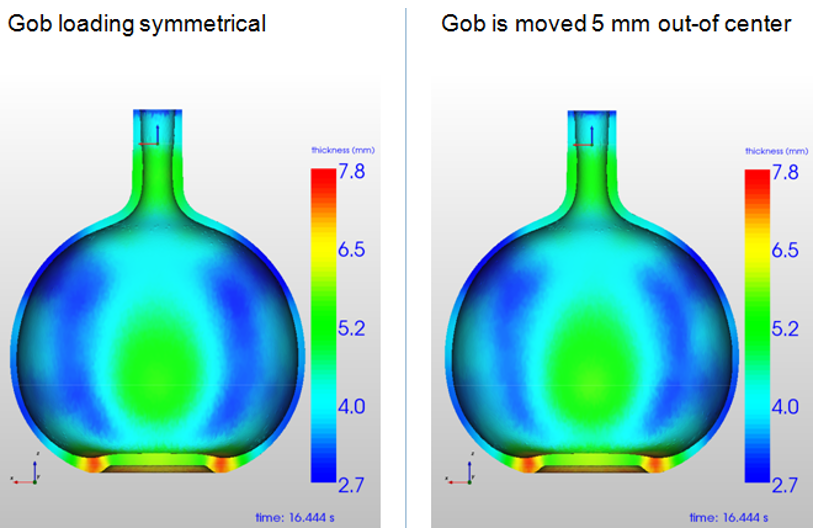
Figure 12: Comparison wall thickness for C2-0 and C2-1
The initial gob position for Case C2-1 is 5 mm displaced from the center axis and the temperature time step images are shown in Figure 14, whereas the corresponding wall thickness is plotted in Figure 13. Same as for the C1-1 case the final wall thickness distribution shows only a small difference between the left and right wall thickness of 0.25 mm.
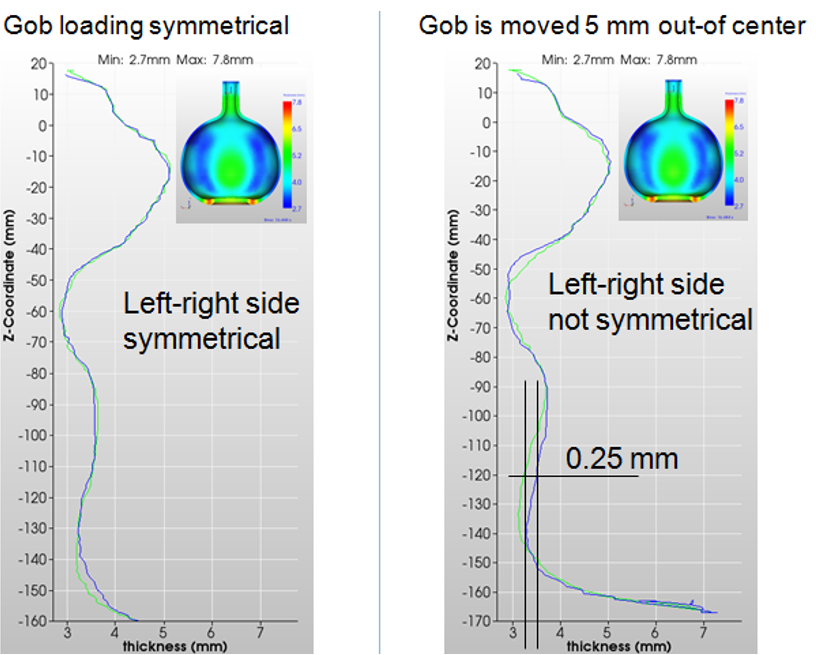
Figure 13: XY-plot wall thickness for C2-0 and C2-1
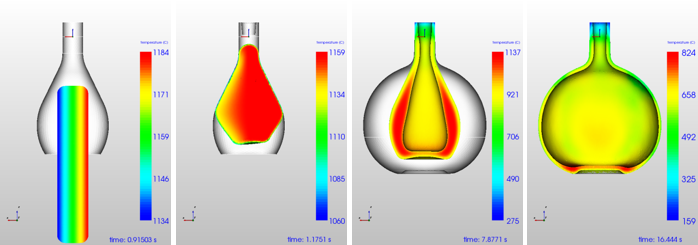
Figure 14: C2-2 Time steps: gob-∆T= 50°C
The results of the case C2-2 and C2-3 computations are shown in Figure 15 and Figure 16. Temperature differences in the gob, here perpendicular to the gob axis do have a higher impact on the final wall thickness distribution than the non-symmetric loading. For this container a temperature difference in the initial gob of ∆T=50 °C generates a wall thickness difference from left to right of 0.9 mm and a gob ∆T of 100 °C produces a wall thickness difference from left to right of 1.4 mm.
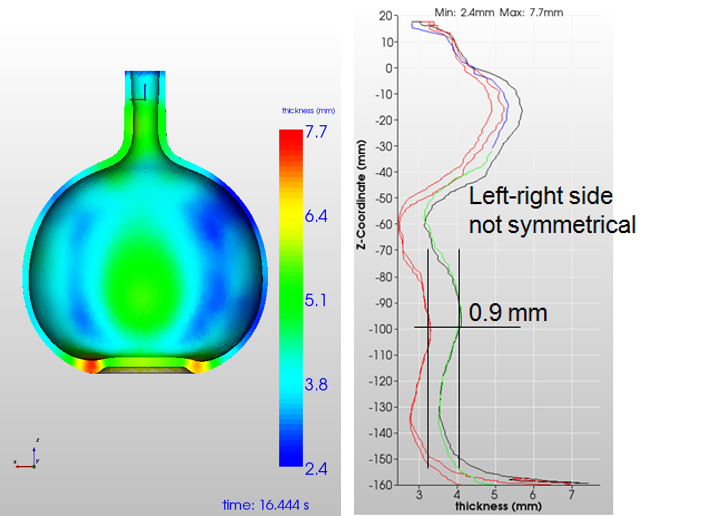
Figure 15: Wall thickness for C2-2: gob-∆T= 50°C
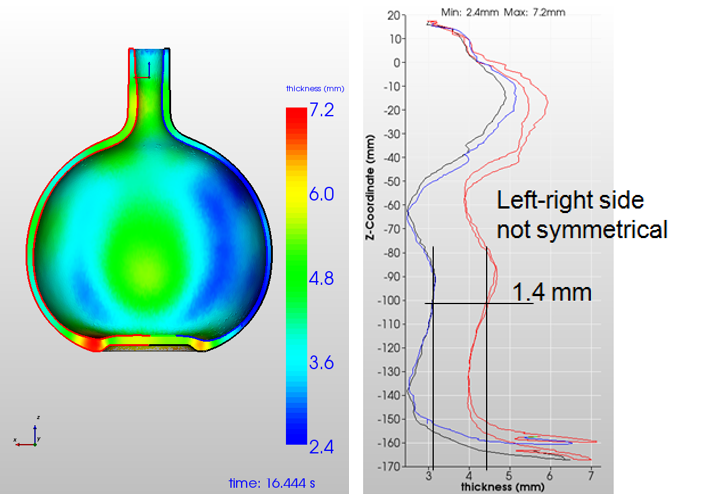
Figure 16: Wall thickness for C2-3: gob-∆T= 100°C
Summary
NOGRID software allows glass container forming processes to be simulated in full 3D and in a very practicable time. In this paper two containers were investigated regarding non-symmetric gob loading and inhomogeneous gob temperature distribution. As most of the results are coupled with the specific container design, it can be concluded that the influence of temperature differences in the gob is much more important for the final container wall thickness distribution than a gob loading displaced from the center axis.
Nogrid's strengths
Particular strengths of NOGRID's fluid flow CFD software are the rapid preprocessing (no fluid grid needs to be generated, only the boundary mesh, inner finite points are generated automatically depending on User setting initially and during computation), and the outstandingly short computation time even for complicated cavities.
As you can see in the image below, the boundary of the geometry still requires a mesh to allow the interior finite points to detect the boundary. The boundary must therefore be meshed and the finite points inside are automatically generated during the simulation controlled by User specifications.
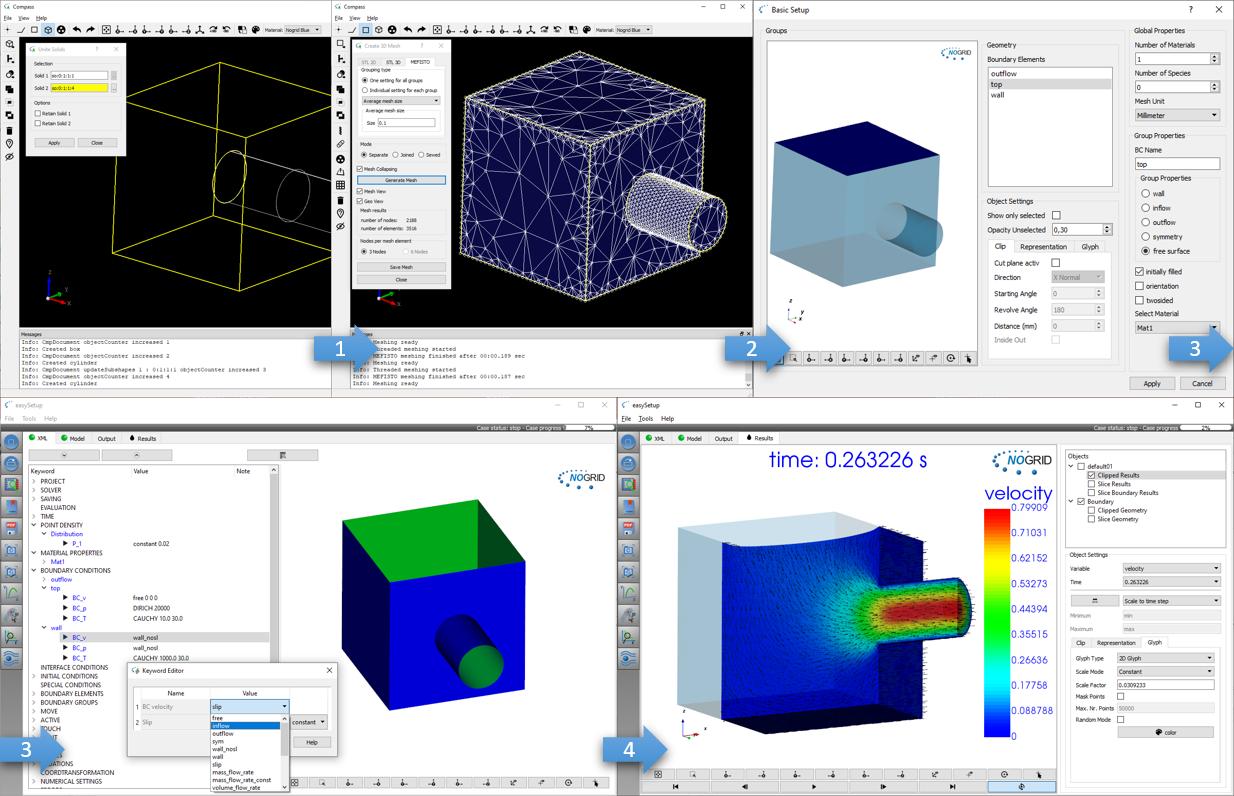
Easy and fast modelling: Build geometry, mesh boundary, setup the case and start computation
What is CFD from NOGRID?
CFD solves the fundamental equations that define the fluid flow process. With CFD software from NOGRID every engineer makes better decisions by predicting, analyzing and controlling fluid flow, heat and mass transfer or chemical reaction. By using NOGRID software for flow modeling you receive information on essential flow characteristics as for example flow distribution. Using it additional to testing and experimentation NOGRID software helps to improve the evaluation of your design – resulting in better construction and operation parameters, increasing planning security and money savings due to faster time to the marketplace for your product or process.
Choose NOGRID
With NOGRID, you choose professional CFD software and services – our aim is helping you to be successful. When you decide to work with NOGRID you choose close cooperation with a dynamic, flat hierarchies-organization. Short information channels result in quick and accurate professional support and service. Our team consists of highly qualified employees, who are experts in fields such as numerical simulation or computational fluid dynamics. Based on our know-how, we are pleased to offer the following services, responding to your individual requirements:
TRAINING
In our two-days training courses you will learn, how to use NOGRID CFD software efficiently. Our technical support team will teach you how to handle and solve different cases.
For more details please refer to Training Courses →
Technical Support
We offer full professional support from the minute you start using our software, by telephone or by email. Contact us, when ever needed.
For more details please refer to Software Support →
Service
Lack of time or resources and other constraints often make outsourcing an attractive solution. We help you with your flow modeling needs. Based on our engineering expertise in this field we offer individual numerical simulation services matching the unique needs of your organization.
For more details please refer to Simulation Services →